Platform
Use Cases
Many Possibilities. One Platform.
AI and Automation
The Always-on Incrementality Platform
Solutions
Teams
Built for your whole team.
Industries
Trusted by all verticals.
Mediums
Measure any type of ad spend
Use Cases
Many Possibilities. One Platform.
AI and Automation
The Always-on Incrementality Platform
Teams
Built for your whole team.
Industries
Trusted by all verticals.
Mediums
Measure any type of ad spend

When starting INCRMNTAL somewhere during 2020, we came up with a few assumptions. Many of our assumptions and premonitions were correct (Apple ATT being the top one), but there was one assumption we had that was completely and utterly off.
We believed that marketing data would be extremely well organized.
It does make sense, no ? If a company is spending a few million dollars on marketing per month – one would assume that the data would be kept in extremely high quality, organized across a well maintained dashboard or database tool, available to be exported or using API, so that our software could connect easily and function with no friction.
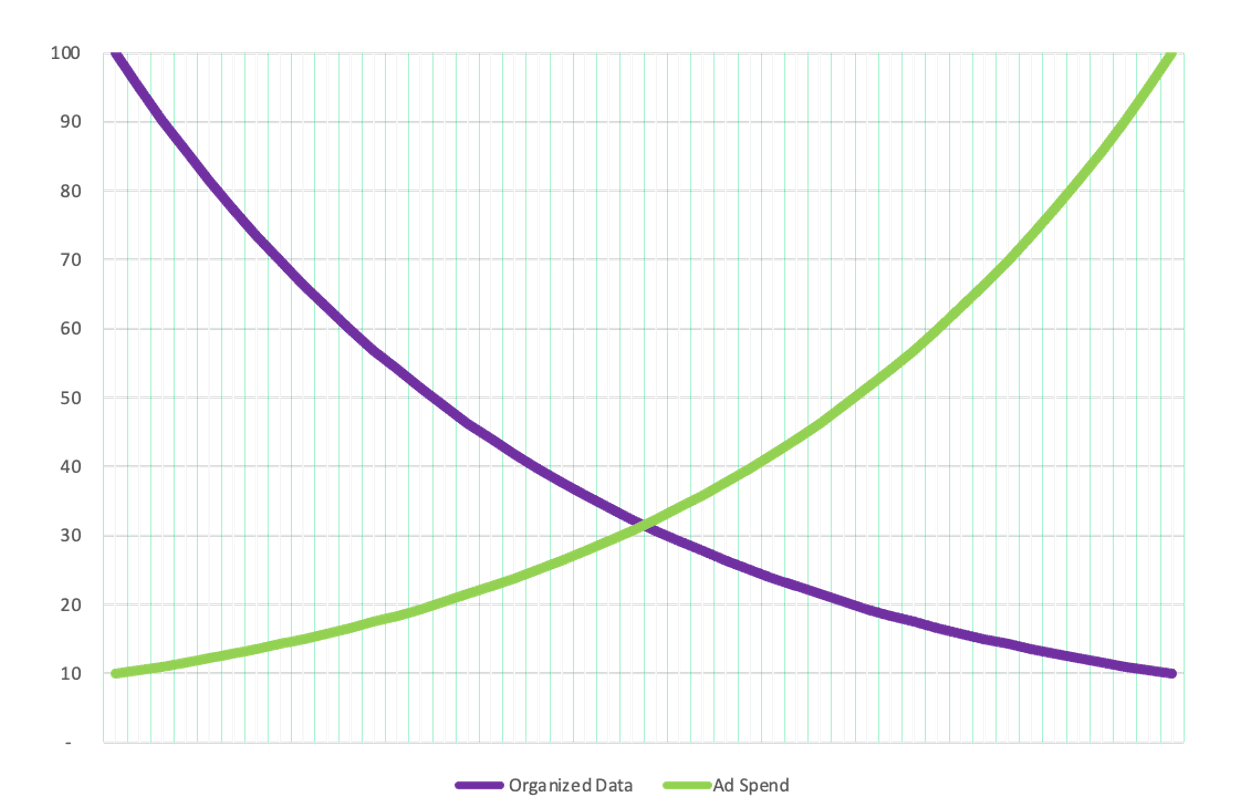
What we learned as we started working with design partners, and later, customers, was marketing data is far from being organized. And the level of messiness is almost directly correlating with the size of the budgets spent.
It is as if there is an opposite correlation between the two.
What we learned was that in larger companies, often, the data is scattered across various teams.
The social team might have access to daily reporting coming directly from the platforms.
The search team are happy using Google and Apple Search ads own reports.
If influencer marketing is active – teams would be capturing information about influencers, schedules, and spend using tools like Google Sheets, or Excel.
If the Advertiser is using offline channels such as TV, OOH, and so on – those might be managed via an agency, who at best would be providing reporting data on a semi-frequent basis.
We learned that even tools and platforms that are exclusively designed for cost consolidation were often unreliable. Data was often not complete the day after, or there was a certain logic for how data gets updated – often not reflected in the tools API documentation, causing discrepancies and challenges with data quality.
INCRMNTAL is a predictive analytics platform. Predictive analytics is an area that depends on good data quality. We could not afford the issues we faced, and needed to find solutions.
The data we needed from our customers was relatively simple to get:
How many conversions were generated by Google (for example) seems to have been the cause of marketing data being extremely disorganized. But this question goes back to the notion of user-based attribution, and is not required for incrementality measurement.
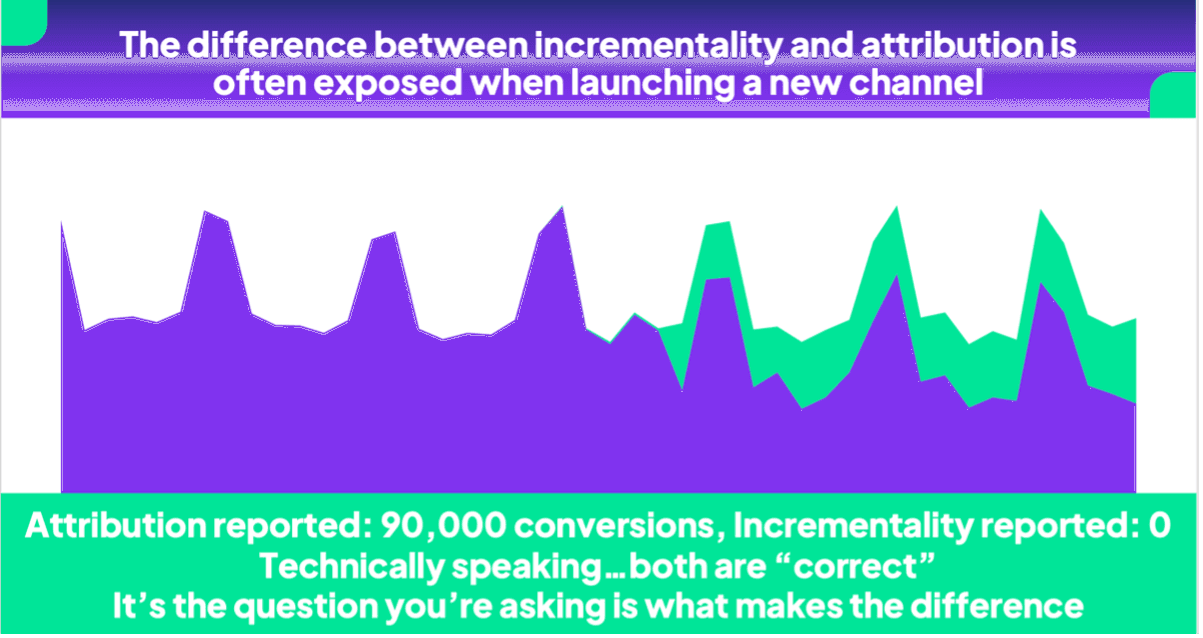
Incrementality measurement will often show a completely different picture than attribution, given that the nature of incrementality is to measure value, not attribute users.

Once we understood that we do not need attribution data – we circumvented the matching problem
The only “matching” INCRMNTAL actually needs is date and country. Marketing data, and spend data do not need to match amongst each other.
That meant that as long as the data was provided in aggregate form, even if there was no “matching” between the spend and marketing data – our platform would function just fine.
This is an actual table from the INCRMNTAL sample data for integration.
Given the simplicity of getting aggregated data from multiple sources and just dumping it on a table, today, the most popular method of integrating data into INCRMNTAL is Google Sheets!
The way we handle data needed to be flexible enough to support delays in reporting, and even mistakes as some data is often handled manually.
Going back to the example of influencer spends, being often updated on some excel, this task is usually done manually. And if the person responsible of updating said excel is off – the data might not be updated for some time.
One solution would have been to just wait until all data is complete and consolidated, but that would cause measurements to be delayed always waiting for the last $0.01 to get updated…
We had to build our integration capabilities to support a continuous overwriting of past data, allowing for mistakes to happen, and also – supporting an incredible feature we developed titled “Expired results”
Expired result is a feature that indicates that the measurement results previously run in a certain country or platform might not be reliable, as new data was added within the duration of the measurement in question. Meaning – if you measured a campaign launched on Google, but a few days later indicated to the platform that you also had a massive TV campaign that started – the platform will indicate to you that the result of the Facebook measurement might be no longer reliable and a new result is ready.
The feature is smart enough to only trigger this alert when the new result is significantly different than the previous one.
Integrations today take less than a day for us. We have customers who onboarded data across 5 different mediums, 20+ advertising channels, and many countries who were able to go from handshake to UI within hours.
We are really proud of our product and engineering teams for building such an integration sophisticated yet simple process.
If you want to learn more about our integration capabilities, check out our integrations section, or better yet – schedule time to speak with us.