Solutions
Teams
Built for your whole team.
Industries
Trusted by all verticals.
Mediums
Measure any type of ad spend
Platform
Use Cases
Many Possibilities. One Platform.
AI and Automation
The Always-on Incrementality Platform
Teams
Built for your whole team.
Industries
Trusted by all verticals.
Mediums
Measure any type of ad spend
Use Cases
Many Possibilities. One Platform.
AI and Automation
The Always-on Incrementality Platform

While we by no means claim to represent a view over the total advertising space, we do have a lot of data, and once every quarter, we love going through the data and producing insights that could be valuable for our customers, as well as for the wider community of marketers.
Last quarter, we did a deep dive into Meta, finding that most of the ad spend we saw was yielding incremental results that were above customers’ performance benchmark, but we also found almost $50M in ad spend was redundant, meaning that it could have either been spent elsewhere, or not spent at all.
Due to popular requests, we decided to zoom into Google this time around.
INCRMNTAL measures the incremental value of advertising (and more) without user level data, and without customers needing to perform any experiments. The platform uses the day to day operational marketing changes marketers do as the fuel to the causality modeling built.
If you want to learn more about our methodology and platform – schedule a demo with us.
To conduct this analysis, we measured the incremental impact Google had for each and every one of our customers, comparing the measurement results to the average benchmark each customer has.
i.e. if a certain customer average ROAS is 100% and Google’s performance was at 114% ROAS > Google was 14% above the customers’ benchmark.
For this analysis, we had to run hundreds of measurements, each one utilizing long term seasonality, short term seasonality, external variables were relevant, and every other marketing activity each customer did around the time of the measurements.
The results were quite interesting.
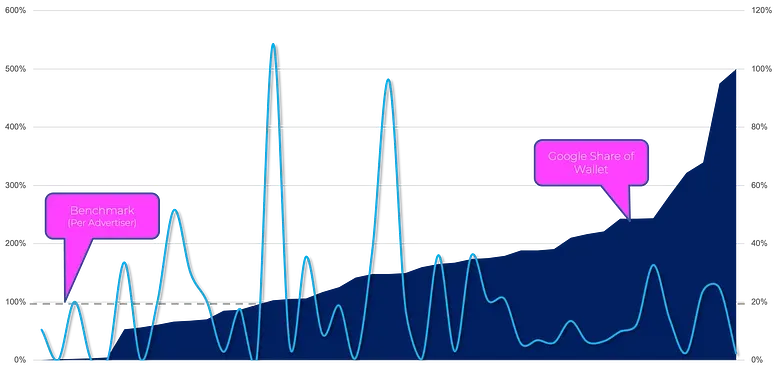
Overlaying the share of wallet Google represented for each and every customer (ranging from 0.3% to 99.9%), as well as the performance of Google’s ad spend in Q4 against each customers’ benchmark – we saw no correlation between the share of wallet and the performance.
If you look at the graph below you can see that there were many advertisers spending a good portion of their ad spend across Google entities but not enjoying substantial incremental results during Q4.

Grouping 19 sub verticals into 5, we benchmarked Google’s Q4 ad spend against each customers’ performance and found the most consistent positive results for eCommerce Advertisers.
This is the least surprising insight we found. Google’s strength is the bottom of the funnel, targeting users with high intent. For eCommerce brands, Google offers incredible capabilities such as seasonal adjustments, and the new PMAX campaign type.

The graph below did surprise us. We would have assumed that there would be a high correlation between how much a brand was spending on Google vs. the performance of Google – however, this was not the case.
We do still find that advertisers tend to overspend during peak seasonality, where what the data shows is that often – spending (extra) during peak seasonality does not bring the same incremental value in comparison with “normal” times.

Google is “King of the Web” and here, we thought that we would see web advertisers enjoying great incremental results from Google during Q4 – but that was not the case.
We actually saw web advertisers (companies whose product is not available as a mobile app – but only as a website, or mobile website) gaining the least positive incrementality from Google during Q4.

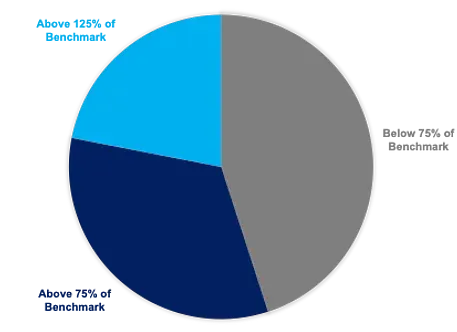
45% of the spend we saw on Google during Q4 was below Advertisers’ benchmarks. Yeah – that’s a shocker.
While we’re glad to have seen that most of the ad spend (about $155M) was yielding incremental results that were meeting or above our customers’ benchmarks – we also saw a lot of ad spend that could have either been optimized better, or saved altogether.
Q4 is a tricky quarter for Advertisers. Consumer’ sentiment pushes sales up for many Advertisers, but in conjunction with that – competition drives up CPMs.
Spending more on Q4 has become a habit for many brands, and going against this trend is almost an impossible task.
A few companies are able to against this trend, benefiting by making decisions that support profitability by cutting the right ad spend in the right time.

Repeating the disclaimer we started with – Incrementality, performance, value are all relative terms. In no way we are saying that “Google doesn’t work” for the advertisers’ who’s performance showed up as below benchmarks.
Some advertisers will accept lower performance during peak seasonality, and some would compensate with extremely strong performance on Google during other times.
Measuring the incremental value is not a one off, and it’s important that brands measure the actual value of their advertising activities continuously, re-evaluating their media plan and media mix to fit their marketing objectives.
We would love to hear any thoughts, questions, or feedback from you.
We cannot and will not expose any of the individual measurements of our customers, but are happy to talk more about this study with marketers who want to learn more.
Which channel should we zoom into next quarter ? TikTok ? Twitter ? Apple Search Ads ? Programmatic DSPs?
Schedule a demo if you want to see our platform in action!

Maor is the CEO & Co-Founder at INCRMNTAL. With over 20 years of experience in the adtech and marketing technology space, Maor is well known as a thought leader in the areas of marketing measurement. Previously acting as Managing Director International at inneractive (acquired by Fyber), and as CEO at Applift (acquired by MGI/Verve Group)